


Average variable cost is the variable cost incurred per unit of output. Calculate it by dividing total variable cost by the quantity produced:
If a business spends $4,000 on variable production costs and produces 1,000 units, its average variable cost is $4 per unit.


AVC includes costs that change with production, such as materials, packaging, or output-linked fees. It excludes fixed costs that remain unchanged over the relevant short-run production range. Because of that exclusion, AVC can help analyze variable unit costs, but it cannot show total profitability by itself.
OpenStax defines average variable cost as variable cost divided by the quantity of output produced.
- Formula: AVC = total variable cost ÷ quantity produced
- Measures: Variable cost per unit of output
- Excludes: Fixed costs
- Result: Dollars per product, order, delivery, job, or another output unit
Average Variable Cost Formula
The standard average variable cost formula is:
[
AVC=\frac{TVC}{Q}
]
Where:
- AVC means average variable cost.
- TVC means total variable cost.
- Q means quantity produced.
The result must be matched to the output being measured. A manufacturer might calculate dollars per product, while a service company might calculate dollars per appointment, delivery, or completed job.
There are two common ways to calculate AVC.
Formula 1: Divide Total Variable Cost by Output
Use this formula when total variable cost and output are known:
[
AVC=\frac{TVC}{Q}
]
Suppose a company records:
- Total monthly variable cost: $4,800
- Monthly output: 1,200 units
Its average variable cost is:
[
AVC=\frac{$4,800}{1,200}=$4
]
The company incurs an average of $4 in variable costs per unit.
The cost and output figures must cover the same period. One month of variable costs should not be divided by a full year of production.
Formula 2: Subtract Average Fixed Cost From Average Total Cost
Average total cost consists of average fixed cost plus average variable cost:
[
ATC=AFC+AVC
]
Rearranging the equation gives:
[
AVC=ATC-AFC
]
Suppose a business has:
- Average total cost: $9 per unit
- Average fixed cost: $3 per unit
Its AVC is:
[
AVC=$9-$3=$6
]
This method is useful in economics problems where average total cost and average fixed cost are provided but total variable cost is not.
Can AVC Be Calculated at Zero Output?
No. AVC is undefined when quantity equals zero.
The formula requires division by quantity:
[
AVC=\frac{TVC}{Q}
]
When (Q=0), the calculation requires division by zero. Even if total variable cost is also zero, there are no units over which to average the cost.
Average Variable Cost Calculation Worksheet
Use this worksheet to calculate AVC manually.
Step 1: Record Total Variable Cost
[
TVC=$,______
]
Step 2: Record Output for the Same Period
[
Q=______\text{ units, orders, jobs, or other output}
]
Step 3: Divide TVC by Output
[
AVC=\frac{$,______}{______}
]
Example
For total variable cost of $7,650 and output of 1,800 units:
[
AVC=\frac{$7,650}{1,800}=$4.25
]
The average variable cost is $4.25 per unit.
The calculation performs only the division. It does not determine whether the expenses entered were classified correctly.
Read More:
Which of the Following Is a Variable Expense?
How to Calculate Average Variable Cost
Use the following process when calculating AVC from business records.
1. Choose the Cost Period
Decide whether the calculation covers:
- One production run
- One week
- One month
- One quarter
- Another clearly defined period
Use the same period for costs and output.
2. Define the Output Unit
Decide what the calculation will measure, such as:
- Products manufactured
- Orders fulfilled
- Deliveries completed
- Meals served
- Client jobs completed
Do not combine different output measures in one calculation.
3. Identify Costs That Change With Output
Include expenses that rise or fall as the selected activity changes.
Possible examples include:
- Direct materials
- Packaging
- Output-linked labor
- Per-transaction fees
- Order-linked fulfillment costs
Cost classification depends on how the expense behaves. The name of the expense alone is not enough.
4. Add the Variable Costs
Add the relevant expenses to find total variable cost:
[
TVC=VC_1+VC_2+VC_3+\ldots
]
5. Find Output for the Same Period
Use the number of products, orders, jobs, or other output units generated during the period covered by TVC.
6. Divide TVC by Output
[
AVC=\frac{TVC}{Q}
]
7. Label the Result
A result of $4 should be written as:
- $4 per product
- $4 per order
- $4 per delivery
- $4 per completed job
The label tells the reader what the average actually measures.
Decide Which Costs Actually Vary With Output
A cost should be included in TVC only when its variable portion changes with the relevant activity.
For example:
- Direct materials often increase with production.
- Packaging may increase with products or orders.
- Piece-rate labor may increase with units completed.
- Payment-processing fees may increase with transactions.
- Fulfillment charges may increase with orders shipped.
However, the same categories can behave differently under different agreements. Salaried labor may remain fixed, while software or shipping expenses may contain both fixed and usage-based charges.
OpenStax explains that cost classifications can change according to how the information will be used. It also distinguishes fixed, variable, mixed, and stepped costs.
Keep Cost and Output Periods Consistent
Consider this incorrect calculation:
- January variable costs: $10,000
- Full-year output: 20,000 units
- Reported AVC: $0.50
The arithmetic works, but the result is misleading because the periods do not match.
The correct comparison might be:
- January variable costs: $10,000
- January output: 2,000 units
- AVC: $5 per unit
Before dividing, confirm that:
- Costs and output cover the same period.
- Costs relate to the same operation.
- The output measure is consistent.
- Fixed expenses are excluded.
- Mixed costs have been separated when possible.
- All amounts use the same currency.

Average Variable Cost Example
Consider a hypothetical candle manufacturer that produces 1,000 candles in one month.
Its variable production costs are:
| Variable cost | Monthly amount |
| Wax, fragrance, and wicks | $1,800 |
| Containers and packaging | $900 |
| Output-linked production labor | $1,100 |
| Labels and production supplies | $200 |
| Total variable cost | $4,000 |
The business calculates:
[
AVC=\frac{$4,000}{1,000}=$4
]
Its average variable cost is $4 per candle.
The $4 figure can be compared with earlier months or other output levels to identify changes in variable unit cost. A complete profitability analysis would also require price, sales volume, and fixed costs.
Example Across Several Production Levels
AVC may change as output changes. The following hypothetical example shows total variable cost, AVC, and marginal cost across several output levels.
| Output | Total variable cost | AVC | MC over previous interval |
| 100 units | $800 | $8.00 | — |
| 200 units | $1,200 | $6.00 | $4.00 |
| 300 units | $1,500 | $5.00 | $3.00 |
| 400 units | $2,100 | $5.25 | $6.00 |
| 500 units | $3,000 | $6.00 | $9.00 |
From 100 to 300 units, AVC falls from $8 to $5. The additional output costs less than the existing average.
After 300 units, marginal cost rises above AVC. That pushes AVC upward to $5.25 and then $6.
These figures are illustrative. Actual costs may change irregularly because of supplier prices, batch purchases, overtime thresholds, capacity constraints, or changes in production efficiency.
What Are Five Examples of Variable Costs?
Five expenses that may behave as variable costs are:
- Direct materials: Inputs used to manufacture a product.
- Packaging: Boxes, containers, labels, or wrapping tied to output.
- Output-linked labor: Piece-rate labor or additional hours caused directly by production.
- Transaction fees: Charges applied to individual sales or payments.
- Order-linked fulfillment: Shipping supplies or fulfillment charges that rise with order volume.
These classifications are not universal. The terms of the expense determine whether it is fully variable.
Costs That Are Partly Fixed and Partly Variable
A mixed cost contains both fixed and variable components.
Examples include:
- Electricity with a base service fee and usage charge
- Software with a subscription plus per-transaction pricing
- Labor with guaranteed hours plus production overtime
- Shipping with a monthly minimum plus per-package fees
When possible, separate the fixed portion and include only the activity-based portion in TVC.
OpenStax describes mixed costs as expenses containing both a fixed component and a variable component. It also explains that stepped costs can remain unchanged within one activity range and then increase when a threshold is crossed.
Average Variable Cost vs Variable Cost
Average variable cost is not the same as total variable cost.
Variable cost is the total amount spent on expenses that change with activity. Average variable cost converts that total into a cost per unit.
| Metric | Formula | What it shows |
| Total variable cost | Sum of variable expenses | Total variable spending |
| Average variable cost | TVC ÷ output | Variable cost per unit |
Suppose two businesses report:
| Business | Total variable cost | Output | AVC |
| Business A | $5,000 | 1,000 units | $5 |
| Business B | $10,000 | 2,000 units | $5 |
Business B has twice the total variable cost, but both businesses have the same AVC because Business B also produces twice as many units.
Average Variable Cost vs Average Total Cost
Average variable cost includes only variable expenses. Average total cost includes both fixed and variable expenses.
| Metric | Formula | Includes fixed cost? |
| AVC | TVC ÷ Q | No |
| ATC | Total cost ÷ Q | Yes |
The relationship is:
[
ATC=AFC+AVC
]
A product can therefore sell for more than AVC while still selling for less than its full average cost.
Average Variable Cost vs Marginal Cost
Average variable cost and marginal cost answer different questions.
- AVC asks: What is the average variable cost across the current output?
- MC asks: How much did cost change when output increased?
| Question | Average variable cost | Marginal cost |
| What does it measure? | Average variable cost across output | Incremental cost of added output |
| Formula | TVC ÷ Q | Change in total cost ÷ change in quantity |
| Output considered | All output in the calculation | The additional output interval |
| Main purpose | Average unit-cost analysis | Incremental production analysis |
Marginal cost is calculated as:
[
MC=\frac{\Delta TC}{\Delta Q}
]
In the short run, fixed cost does not change with output, so the change in total cost is also the change in variable cost.
OpenStax explains that marginal cost may be calculated over a group of additional units rather than only one physical unit.
How Marginal Cost Changes Average Variable Cost
The relationship works like adding a new score to an existing average:
- If MC is below AVC, it pulls AVC down.
- If MC is above AVC, it pushes AVC up.
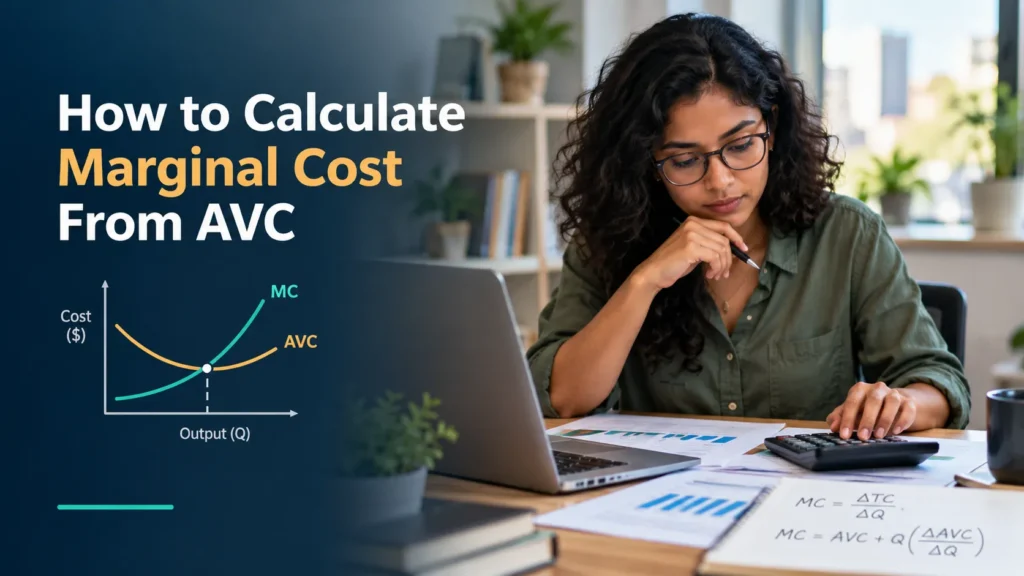
- In the standard smooth short-run model, MC crosses AVC at AVC’s minimum.
In a discrete table, the exact intersection may occur between the output levels displayed.
In the earlier example, AVC at 300 units is $5. The next 100 units have an estimated marginal cost of $6 each. Because $6 is above the existing average, AVC rises to $5.25 at 400 units.
How to Calculate Marginal Cost From AVC
One AVC value is not enough to calculate marginal cost.
You need AVC and output at two levels.
First, reconstruct total variable cost at each output:
[
TVC_1=AVC_1\times Q_1
]
[
TVC_2=AVC_2\times Q_2
]
Then calculate marginal cost over the interval:
[
MC=\frac{TVC_2-TVC_1}{Q_2-Q_1}
]
Using the earlier example:
- At 300 units, AVC is $5.
- At 400 units, AVC is $5.25.
Calculate TVC at each level:
[
TVC_1=$5\times300=$1,500
]
[
TVC_2=$5.25\times400=$2,100
]
Then calculate MC:
[
MC=\frac{$2,100-$1,500}{400-300}
]
[
MC=\frac{$600}{100}=$6
]
The estimated marginal cost is $6 per additional unit over the 300-to-400-unit interval.
This does not mean that every individual unit in the interval necessarily cost exactly $6.
What the Average Variable Cost Curve Shows
In the standard short-run economics model, the AVC curve is typically U-shaped.
AVC falls while marginal cost is below it and rises after marginal cost moves above it. In a smooth textbook curve, MC crosses AVC at AVC’s minimum point.
A change in AVC can point to several possible causes:
| AVC movement | Possible explanation | What to inspect |
| Falling | More efficient use of variable inputs | Setup time, batch size, material waste |
| Stable | Costs are moving roughly with output | Supplier prices and labor productivity |
| Rising | Capacity or input-cost pressure | Overtime, defects, congestion, rush charges |
These are diagnostic possibilities rather than conclusions. AVC alone cannot identify why a company’s costs changed.
Why Accounting and Economics Examples May Look Different
Basic managerial-accounting examples often assume that variable cost per unit remains constant within a relevant activity range. Under that assumption, total variable cost changes in proportion to output.
Economics examples frequently allow variable cost per unit to change as production rises, producing the familiar U-shaped AVC curve.
The two approaches serve different teaching and decision purposes. Before using a model, check which assumptions the calculation makes about cost behavior. OpenStax’s managerial-accounting material describes constant per-unit variable cost within a basic cost-behavior example, while its economics text examines changing AVC and MC across output levels.
How Businesses Should Interpret Average Variable Cost
AVC is most useful when compared across production levels, periods, or products using consistent cost classifications.
For example:
- A rising AVC may justify checking overtime, waste, supplier prices, or capacity constraints.
- A falling AVC may indicate that additional output is using variable inputs more efficiently.
- A comparison between products is meaningful only when costs and output are measured consistently.
- A price above AVC means variable costs are covered per unit, but it does not establish total profit.
Use AVC as a diagnostic metric, not as a standalone pricing or profitability rule.
AVC Is Not the Same as Profitability
Suppose a product sells for $7:
- AVC is $5.
- Average fixed cost is $3.
- ATC is $8.
The product generates $2 per unit above variable cost, but its price remains $1 below average total cost.
In this simplified example, production contributes toward fixed costs while total profit remains negative.
A full analysis also requires sales volume, total revenue, fixed costs, cash flow, and relevant market constraints.
AVC and the Short-Run Shutdown Point
In the standard perfectly competitive short-run model, the shutdown point occurs at minimum AVC, where the MC curve crosses the AVC curve.
- If price is above minimum AVC, the firm covers its variable costs at the profit-maximizing output and may continue operating in the short run.
- If price is below minimum AVC, the textbook model indicates that shutting down production produces a smaller loss.
OpenStax presents the shutdown point as the intersection of MC and AVC and explains that a perfectly competitive firm operating below minimum AVC cannot cover its variable costs.
Federal Reserve Education similarly illustrates why a business may continue operating at a short-run loss when its revenue covers variable costs and part of its unavoidable fixed costs.
Real businesses may also need to consider:
- Restart costs
- Contracts
- Financing obligations
- Employee commitments
- Multiple products
- Expected future demand
- Opportunity costs
The textbook shutdown rule is an economic model, not automatic instructions to close or continue a real operation.
Common Average Variable Cost Mistakes
| Mistake | Why it is wrong | Better approach |
| Including fixed costs | Produces a broader unit-cost measure | Include only variable costs |
| Dividing by revenue | Revenue is not output quantity | Divide by units, orders, jobs, or another output measure |
| Mixing periods | Costs and production are not comparable | Match monthly costs with monthly output |
| Treating all labor as variable | Salaries or guaranteed hours may not change with output | Review the labor arrangement |
| Ignoring mixed costs | The fixed component inflates TVC | Separate fixed and variable portions |
| Using units sold without checking | Production and sales may differ | Use the output measure required by the analysis |
| Confusing AVC with MC | An average is not an incremental cost | Calculate the metrics separately |
| Treating AVC as total unit cost | Fixed costs remain excluded | Use ATC for full average cost |
| Calculating AVC at zero output | Division by zero is undefined | Calculate AVC only when output is positive |
| Assuming AVC never changes | Cost behavior and input prices can change | Compare relevant periods and output levels |
Frequently Asked Questions
Does Average Variable Cost Include Fixed Costs?
No. AVC includes variable costs only. Average total cost includes both fixed and variable costs.
Can AVC Be Calculated at Zero Output?
No. AVC is undefined when output is zero because the formula requires division by quantity.
Is Labor Always a Variable Cost?
No. Piece-rate or output-linked labor may be variable. Salaries, guaranteed shifts, and some hourly labor arrangements may be fixed or mixed.
What Is the Difference Between AVC and Cost per Unit?
AVC measures variable cost per unit. The broader phrase “cost per unit” may refer to total unit cost, which includes fixed and variable costs. Check which expenses are included before comparing the figures.
When Does Marginal Cost Equal Average Variable Cost?
In the standard smooth short-run cost model, marginal cost crosses average variable cost at AVC’s minimum point. In a table with separate output intervals, the exact crossing may fall between the values displayed.
What to Calculate After AVC
AVC tells you the average variable cost attached to each unit of output. The next metric depends on the decision you need to make.
| Question | Metric to review |
| What is the full average cost per unit? | Average total cost |
| What does additional output cost? | Marginal cost |
| How much selling price remains after variable costs? | Contribution margin |
| How many sales cover all costs? | Break-even point |
| Why did variable unit cost change? | Cost classifications and operating data |
| Is the business profitable? | Total revenue, total cost, and profit |
Before relying on AVC, confirm that the cost period, output measure, and cost classifications are consistent.












Comments 1